
Page 16 - Tecno Pan Julio 2024
P. 16
Seguimiento de Oferta y Demanda de Cereales
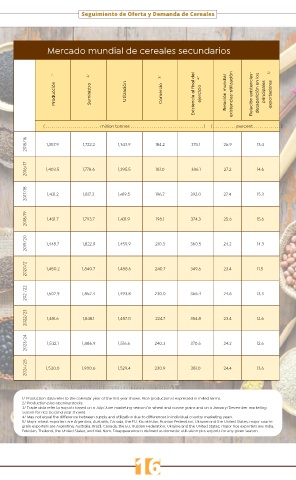
Mercado mundial de cereales secundarios
1/ 2/ 3/ 4/ 5/
Producción Suministro Utilzación Comercio Existencia al final del ejercicio Relación mundial existencias-utilización Relación existencias- desaparición en los principales exportadores
( . . . . . . . . . . . . . . . . . . . . . . . . . . million tonnes . . . . . . . . . . . . . . . . . . . . . . . . . . . . . . . . . . . ) ( . . . . . . . . . . . percent . . . . . . . . . . . . . )
2015/16 1,357.9 1,722.2 1,343.9 184.2 375.1 26.9 13.4
2016/17 1,403.5 1,778.6 1,395.5 181.0 386.1 27.2 14.6
2017/18 1,431.2 1,817.3 1,419.5 196.7 392.0 27.4 15.3
2018/19 1,401.7 1,793.7 1,431.9 198.1 374.3 25.6 15.6
2019/20 1,448.7 1,822.9 1,459.9 210.3 360.5 24.2 14.3
2020/21 1,480.2 1,840.7 1,488.6 240.7 349.6 23.4 11.5
2021/22 1,502.9 1,852.4 1,493.8 230.0 366.4 24.6 13.3
2022/23 1,481.6 1,848.1 1,487.0 224.7 354.8 23.4 12.6
2023/24 1,532.1 1,886.9 1,516.6 240.3 370.6 24.2 12.6
2024/25 1,530.0 1,900.6 1,529.4 230.9 381.0 24.4 13.6
1/ Production data refer to the calendar year of the first year shown. Rice production is expressed in milled terms.
2/ Production plus opening stocks.
3/ Trade data refer to exports based on a July/June marketing season for wheat and coarse grains and on a January/December marketing
season for rice (second year shown).
4/ May not equal the difference between supply and utilization due to differences in individual country marketing years.
5/ Major wheat exporters are Argentina, Australia, Canada, the EU, Kazakhstan, Russian Federation, Ukraine and the United States; major coarse
grain exporters are Argentina, Australia, Brazil, Canada, the EU, Russian Federation, Ukraine and the United States; major rice exporters are India,
Pakistan, Thailand, the United States, and Viet Nam. Disappearance is defined as domestic utilization plus exports for any given season.
16