
Page 14 - Tecno Pan Julio 2024
P. 14
Seguimiento de Oferta y Demanda de Cereales
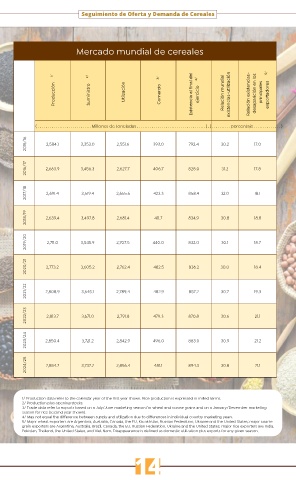
Mercado mundial de cereales
1/ 2/ 3/ 4/ 5/
Producción Suministro Utilzación Comercio Existencia al final del ejercicio Relación mundial existencias-utilización Relación existencias- desaparición en los principales exportadores
( . . . . . . . . . . . . . . . . . . . . . . . . . . Millones de toneladas . . . . . . . . . . . . . . . . . . . . . . . . . . . . . . . . . . . )( . . . . . . . . . . . porcentaje . . . . . . . . . . . . . )
2015/16 2,584.1 3,353.0 2,551.6 393.0 792.4 30.2 17.0
2016/17 2,663.9 3,456.3 2,627.7 406.7 828.0 31.2 17.8
2017/18 2,691.4 3,519.4 2,655.6 423.3 858.4 32.0 18.1
2018/19 2,639.4 3,497.8 2,681.4 411.7 834.9 30.8 18.8
2019/20 2,711.0 3,545.9 2,707.5 440.0 832.0 30.1 18.7
2020/21 2,773.2 3,605.2 2,762.4 482.5 836.2 30.0 18.4
2021/22 2,808.9 3,645.1 2,789.4 482.9 857.2 30.7 19.3
2022/23 2,813.7 3,671.0 2,791.8 479.3 870.8 30.6 21.1
2023/24 2,850.4 3,721.2 2,842.9 496.0 883.0 30.9 21.2
2024/25 2,854.2 3,737.2 2,856.4 481.1 894.3 30.8 21.1
1/ Production data refer to the calendar year of the first year shown. Rice production is expressed in milled terms.
2/ Production plus opening stocks.
3/ Trade data refer to exports based on a July/June marketing season for wheat and coarse grains and on a January/December marketing
season for rice (second year shown).
4/ May not equal the difference between supply and utilization due to differences in individual country marketing years.
5/ Major wheat exporters are Argentina, Australia, Canada, the EU, Kazakhstan, Russian Federation, Ukraine and the United States; major coarse
grain exporters are Argentina, Australia, Brazil, Canada, the EU, Russian Federation, Ukraine and the United States; major rice exporters are India,
Pakistan, Thailand, the United States, and Viet Nam. Disappearance is defined as domestic utilization plus exports for any given season.
14