
Page 17 - Demo
P. 17
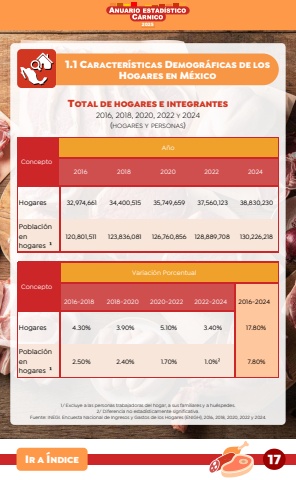
172025IR A %u00cdNDICE1.1 CARACTER%u00cdSTICAS DEMOGR%u00c1FICAS DE LOSHOGARES EN M%u00c9XICOTOTAL DE HOGARES E INTEGRANTES2016, 2018, 2020, 2022 Y 2024(HOGARES Y PERSONAS)1/ Excluye a las personas trabajadoras del hogar, a sus familiares y a hu%u00e9spedes.2/ Diferencia no estad%u00edsticamente significativa.Fuente: INEGI. Encuesta Nacional de Ingresos y Gastos de los Hogares (ENIGH), 2016, 2018, 2020, 2022 y 2024.2016 2018 2020 2022 2024Hogares 32,974,661 34,400,515 35,749,659 37,560,123 38,830,230Poblaci%u00f3n en hogares %u00b9120,801,511 123,836,081 126,760,856 128,889,708 130,226,2182016-2018 2018-2020 2020-2022 2022-2024 2016-2024Hogares 4.30% 3.90% 5.10% 3.40% 17.80%Poblaci%u00f3n en hogares %u00b92.50% 2.40% 1.70% 1.0%%u00b2 7.80%Variaci%u00f3n PorcentualA%u00f1oConceptoConcepto
